A Professional iOS Objective C Stock Chart Library for Your Financial App.
StockChartX iOS is based on our original, award-winning StockChartX library.
Developed in Objective C, StockChartX iOS allows developers to chart real-time financial data, embed objects such as buy and sell arrows, add images to charts, embed social media links, add trend lines and other line studies, insert technical indicators, and much more.
Developed Just for iOS
StockChartX iOS was written in Objective C for iOS and it is also compatible with the Swift programming language. It doesn't require any plugins or 3rd party libraries. It works great on all iPads and iPhones.
Traders Love It
We asked more than 1,200 traders which charting features and technical indicators they wanted in StockChartX. There were lots of valuable feature requests, and we added them all.
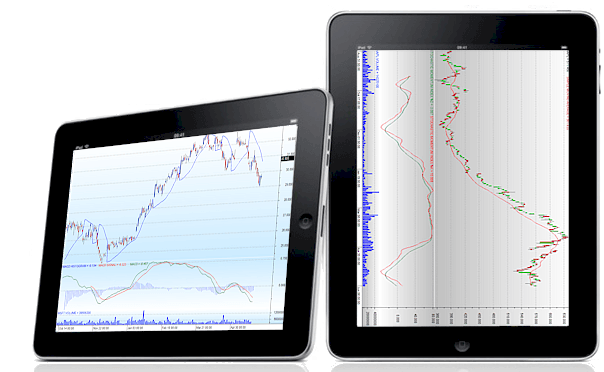
StockChartX features real-time, tick-by-tick charting with High-Low-Close bars, Open-High-Low-Close bars, and Candlestick charts. You can chart real-time market data; insert buy, sell, or exit symbols; insert text, trend lines, custom images, multiple indicators, and overlay indicators (share scales); print charts; save and load charts, and more.
Not enough? You can also add additional functionalities by customizing the chart.
Full source code is available in Objective C. Simply customize the source using xCode on a Mac and upload the entire app to the app store, to save yourself hundreds of hours of development time. It couldn't be any easier.
Click here to read our case study of the Ansaldo STS iTunes app (pdf) or download an example charting app on itunes.
Technical Indicators
StockChartX also features over 80 popular technical indicators which can be customized with user-defined parameters. Our technical indicators have been validated by their authors whenever possible, so you can be sure the calculations are correct. That's why our technical indicator library has won numerous awards by Futures magazine and Stocks & Commodities magazine.
Ongoing Development
We recently added Elder Ray, Keltner Channel, Coppock Curve, Twiggs Money Flow and other popular indicators. We're also working to add more than twice as many technical indicators soon!
Why StockChartX?
When we originally developed StockChartX, we could not find a financial charting component robust enough to meet the requirements of our clients. It seemed that all stock chart libraries out there were developed by... well, charting component companies.
The reality is that charting component companies seem to know very little, if anything, about finance. Their financial charting libraries are normally bundled with other standard charting components: doughnut charts, pie charts, fancy 3D surface charts and reporting engines.
The majority of charting products out there produce financial charts which are inadequate because their financial charting interfaces were designed as an afterthought.
So we decided to build our own financial charting component to meet our clients' needs. Today, StockChartX is the preferred stock charting component of developers and traders around the world.
Modulus Source Code License
The Modulus Source Code License includes approximately three million lines of source code, documentation, and example projects, with a perpetual license, including source code updates, for the following products: TA-SDK C++, C#, Java, JS, VB, TradeScript C++ and C#, StockChartX C++, C#, JS, Java, Obj C, Neural Trader C++, Evo2 C#, PatternLogic C#, MyExchange C#, SuperWebSocket Data Server C#, RMD Server C++, M4 WinForm C#, M4 WPF C#, M4 Forex HTML5, M4 Standard HTML5, M4 iOS Obj C, M4 Mac Obj C, M4 Android Java and more. Most products are provided with complete source code. Support and consulting services available separately.
Schedule Demo
StockChartX iOS Edition Features
- StockChartX iOS supports all of the popular stock chart display styles: Candlestick, OHLCV, OHLC, HLC, and Heiken Ashi Candles. Each of these chart styles can be update in real-time using our Super WebSocket Data Server.
- Smooth anti-aliased painting for all technical indicators and line studies.
- Real-time automatic technical analysis updating.
- Support for built-in Line Studies.
- StockChartX iOS was designed for super high performance real-time trading.
- An unlimited number of series can be displayed in just one chart.
- Data can be imported into StockChartX from any database, text file format, or real-time feed.
- Zoom-in, Zoom-out, scroll-left, and scroll-right programmatically or via the keyboard or mouse wheel.
- Supports trend line drawing, objects (buy/sell arrows, text, etc.) and more.
- Users can save/load charts, restoring data, indicators, colors, drawings, period objects and more.
Programmer F.A.Q.s
- Q. How do I insert data into StockChartX? Is it difficult? A. StockChartX uses a function called AppendValue (series name, date, value). You actually "push" data into StockChartX, so it does not matter where the data comes from, be it a database, text file, XML file, or real time tick-by-tick data – the data goes into StockChartX the same way, quick and simple.
- Q. What do I have to do to add an indicator to StockChartX? A. Just call AddIndicatorSeries (Indicator Type, Key, UserParams). If UserParams is TRUE, the indicator dialog box will appear and the user will be allowed to edit the indicator parameters. If UserParams is FALSE, you will be able to set the parameters programmatically in your code.
- Q. How many panels (price series or indicators) can I have open at once and tiled on top of each other? A. Unlike all other stock chart libraries out there, you are not limited in this department. You can have several indicators and price series on the chart at once. You are only limited by your screen's real estate.
- Q. Can I select symbols, text objects, and series with my mouse and move them? A. Of course. Unlike any other financial chart library out there, StockChartX allows you to grab any series or object, move it around with your mouse, resize it, drag it to another panel, scroll the chart using the mouse wheel, resize panels with the mouse, overlay series, and much more.
- Q. Can I retrieve technical indicator values from StockChartX like I can with TA-SDK? And without showing the technical indicators on the chart? A. Yes, you can calculate technical indicators and retrieve the values without ever displaying the indicator.
- Q. Can I add my own custom series (such as my own indicators) to the chart? A. Yes, StockChartX is designed to allow you to add any type of series to the chart. You can display your series in one of many series styles (bar, line, oscillator, etc.).
- Q. Can I change an individual bar's color? A. Yes.
- Q. What is the file size of StockChartX and does it require any run time files? A. StockChartX is around 2MB and does not require any runtime files or browser plug-ins.
- Q. Do I need a special server to host the chart? A. StockChartX iOS can be hosted on any web server. The code runs on the client side.
- Q. My question wasn't answered here, now what? A. Give us a call! We'd be happy to speak with you: (888) 318-3754. You can also contact us here
