
The Original Stock Chart Library
Trusted by Over 3,000,000 Traders
Originally developed over 15 years ago, StockChartX is our original stock chart library. And it is still the chart of preference for over three million traders around the world today.
Why? Because the high-performance C++ code of StockChartX allows it to run up to 200 times faster than other financial chart components. Nothing else compares.
Since then, we've continually refined it, and now, StockChartX offers the stability you'd expect from over 15 years of product development.
The footprint of StockChartX is small thanks to highly-optimized C++ code. It uses very little RAM and CPU, allowing you to use all 24 of your monitors!
Features
We asked more than 1,200 traders which charting features and technical indicators they wanted in StockChartX. There were lots of valuable feature requests, and we added them all.
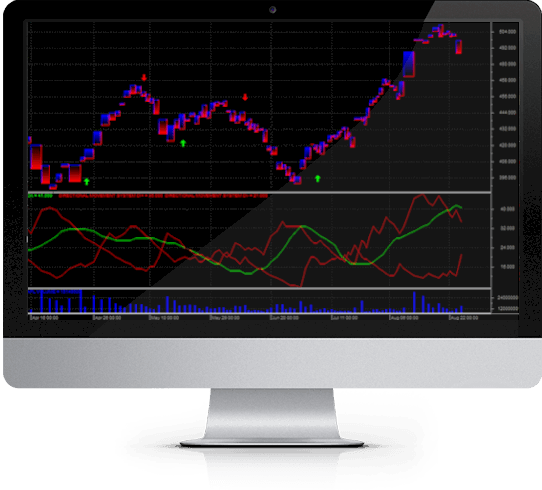
StockChartX features real-time, tick-by-tick charting with High-Low-Close bars, Open-High-Low-Close bars, 2D & 3D Candlestick charts, Renko, Kagi, Three Line Break, Point & Figure, Candle-Volume, Equi-Volume, Shaded Equi-Volume, Heikin Ashi Candlesticks, Darvas Boxes and other price styles.
You can chart real-time market data; insert buy, sell, or exit symbols; insert text, trend lines, custom images, multiple indicators, and overlay indicators (share scales); display charts with semi-log or linear scaling; print charts; save charts as images; save/load charts as binary files and more.
Not enough? You can also add additional functionalities by licensing a 64-bit version for greatly improved performance. Over 35 example programming projects are included with the StockChartX stock chart component.
Technical Indicators
StockChartX also features over 80 popular technical indicators which can be customized with user-defined parameters. Our technical indicators have been validated by their authors whenever possible, so you can be sure the calculations are correct. That's why our technical indicator library has won numerous awards by Futures magazine and Stocks & Commodities magazine. View a complete list of indicators here.
Ongoing Development
Sure, StockChartX has been around for 15 years, but our star products are never phased out. We keep our products going, and we keep them reasonably backwards compatible with older versions.
We recently added Elder Ray, Keltner Channel, Coppock Curve, Twiggs Money Flow and other popular indicators, and the latest version of StockChartX has better graphics and is over 20% faster than previous versions.
So how do we fight bloatware after 15 years? Simple. For every feature we add, we also make it a point to increase performance over the previous version. We keep adding more, but it keeps getting better and faster.
Designed for use with C#, VB.NET and other .NET languages.
While StockChartX isn't based on managed .NET code, it is designed to work seamlessly with managed .NET applications with only minimal COM interop. This means you get the best of both worlds: C++ speed and .NET rapid application development, without sacrificing performance or compatibility. StockChartX C++ Edition is used in our high-performance M4 Trading Platform developed in C#.
Why StockChartX?
We originally developed StockChartX because we could not find a financial charting component robust enough to meet the requirements of our clients. It seemed that all stock chart libraries out there were developed by... well, charting component companies.
The reality is that charting component companies seem to know very little, if anything, about finance. Their financial charting libraries are normally bundled with other standard charting components: doughnut charts, pie charts, fancy 3D surface charts and reporting engines.
The majority of charting products out there produce financial charts which are inadequate because their financial charting interfaces were designed as an afterthought.
So, in 1998, we decided to build our own financial charting component to meet our clients' needs. Now 15 years later, StockChartX is the preferred stock charting component of developers and traders around the world.
Modulus Source Code License
The Modulus Source Code License includes approximately three million lines of source code, documentation, and example projects, with a perpetual license, including source code updates, for the following products: TA-SDK C++, C#, Java, JS, VB, TradeScript C++ and C#, StockChartX C++, C#, JS, Java, Obj C, Neural Trader C++, Evo2 C#, PatternLogic C#, MyExchange C#, SuperWebSocket Data Server C#, RMD Server C++, M4 WinForm C#, M4 WPF C#, M4 Forex HTML5, M4 Standard HTML5, M4 iOS Obj C, M4 Mac Obj C, M4 Android Java and more. Most products are provided with complete source code. Support and consulting services available separately.
Schedule Demo
StockChartX Professional Edition Features
- StockChartX supports all of the popular stock chart display styles: Candlestick, OHLCV, OHLC, and HLC,Heiken Ashi Candles, Darvas Boxes, 3D Candlesticks, Renko, Kagi, Three Line Break, Point & Figure, Candlevolume,
- New, smooth anti-aliased painting for all technical indicators and line studies.
- Real-time automatic technical analysis updating.
- Support for built-in Line Studies such as Ellipse, Rectangle, Trend Line, Speed Lines, Gann Fan, Fibonacci Arcs, Fibonacci Fan, Fibonacci Retracements, Fibonacci Time Zones, Tirone Levels, Quadrant Lines, Raff Regression, and Error Channels.
- New Trend Line Penetration events notify your application whenever a series crosses above or below a trend line. Trend lines can automatically extend into the future.
- StockChartX uses double buffering - this means you will see absolutely no screen flickering.
- An unlimited number of series can be displayed in just one chart.
- Data can be imported into StockChartX from any database, text file format, or real-time feed.
- Full support for Gregorian/Julian date conversions.
- Windowing system allows users to resize, change positions up or down, maximize, minimize, restore, and close chart windows.
- Chart windows are fully customizable programmatically. Change height, colors, styles and more from within your code.
- StockChartX manipulates screen graphics quickly and efficiently without a 3rd party graphics engine. It's the fastest stock chart control available.
- Zoom-in, Zoom-out, scroll-left, and scroll-right programmatically or via the keyboard or mouse wheel.
- Supports trend line drawing, objects (buy/sell arrows, text, etc.) and more.
- Export chart images to file (can be displayed on the web) or send to a printer.
- Users can save/load charts, restoring data, indicators, colors, drawings, period objects and more.
- C++ programming examples are provided, enabling you to modify appearances, add new types of indicators, and other features. Customize your financial charts the way you need them.
Programmer F.A.Q.s
- Q. How do I insert data into StockChartX? Is it difficult? A. StockChartX uses a function called AppendValue (series name, date, value). You actually "push" data into StockChartX, so it does not matter where the data comes from, be it a database, text file, XML file, or real time tick-by-tick data – the data goes into StockChartX the same way, quick and simple.
- Q. What do I have to do to add an indicator to StockChartX? A. Just call AddIndicatorSeries (Indicator Type, Key, UserParams). If UserParams is TRUE, the indicator dialog box will appear and the user will be allowed to edit the indicator parameters. If UserParams is FALSE, you will be able to set the parameters programmatically in your code.
- Q. How many panels (price series or indicators) can I have open at once and tiled on top of each other? A. Unlike all other stock chart libraries out there, you are not limited in this department. You can have several indicators and price series on the chart at once. You are only limited by your screen's real estate.
- Q. Can I select symbols, text objects, and series with my mouse and move them? A. Of course. Unlike any other financial chart library out there, StockChartX allows you to grab any series or object, move it around with your mouse, resize it, drag it to another panel, scroll the chart using the mouse wheel, resize panels with the mouse, overlay series, and much more.
- Q. Can I retrieve technical indicator values from StockChartX like I can with TA-SDK? And without showing the technical indicators on the chart? A. Yes, you can calculate technical indicators and retrieve the values without ever displaying the indicator.
- Q. Can I add my own custom series (such as my own indicators) to the chart? A. Yes, StockChartX is designed to allow you to add any type of series to the chart. You can display your series in one of many series styles (bar, line, oscillator, etc.).
- Q. Can I change an individual bar's color? A. Yes.
- Q. What is the file size of StockChartX and does it require any run time files? A. StockChartX is around 1MB and compiled in C++. No run time files are required.
- Q. Does StockChartX work on older operating systems such as Windows XP? A. Yes, StockChartX runs on all Windows operating systems that are newer than Windows 3.1, and it is designed to take advantage of newer operating system graphic APIs when available. It works even better on Windows 8 and above.
- Q. Does this version of StockChartX work for .NET? A. Yes, StockChartX supports .NET. But we also offer a C# version of StockChartX. See StockChartX WPF.
- Q. Do you offer customization services for StockChartX? A. Yes. Please contact us for details.
- Q. My question wasn't answered here, now what? A. Give us a call! We'd be happy to speak with you: (888) 318-3754. You can also contact us here
