Financial Charting Component
Introducing
StockChartX Version 5.0, a powerful financial chart control featuring
advanced charting types: 3D Candlesticks, Renko, Kagi, Three Line Break, Point & Figure, Candlevolume, Equivolume, Shaded
Equivolume, Heikin Ashi Candlesticks, Darvas Boxes,Technical Analysis and more!
Now developers can leverage their knowledge and existing code to easily integrate our lightweight COM-based ActiveX stock chart
component. Developing with StockChartX using VB, VB.Net, C#, Excel, VC++,
and Delphi, is
quick and easy. StockChartX supports both Desktop applications and web
charting applications.
No other charting component comes close to the flexibility
and completeness of StockChartX V.5 Pro. Modulus Financial Engineering does
one thing and does it right... we do financial software engineering only!
What this means is that you will find features built right into StockChartX that you will
not find in any other charting component, guaranteed. Features that are
specific to financial applications.....
Finally, a
charting component designed BY traders, FOR traders!
With StockChartX, you can chart real-time stock data, embed objects like buy, sell, exit or custom bitmap symbols, insert text,
trend lines, custom drawings, multiple indicators, overlay indicators (share scales),
display charts with semi-log or linear scaling, print charts, save charts as images, save/load
charts as binary files, and much more!
Use StockChartX as your essential front-end data analysis tool for developing interactive financial applications. StockChartX is the perfect addition to your financial engineering toolbox.
StockChartX V.5 comes with very comprehensive VB6, VC++, VB.net, C#, Delphi
7, Borland C++ Builder, and Excel example projects, each containing 1,000 to 2,000 lines of
highly commented source code.
.NET Compatibility with the HIGHEST
Possible Performance!
StockChartX is designed to work seamlessly with .NET languages as well as
older COM compliant languages.
Because StockChartX was written entirely in the C++ language, and DOES NOT
use .NET GDI+ wrapper functions, you will find StockChartX to be the FASTEST
financial stock charting component around. Up to 100% faster than native .NET charting
packages! StockChartX works seamlessly with C#, VB.NET, and all other
languages without sacrificing performance or compatibility.
Need a pure C#
.NET / WPF financial charting library?
Please see StockChartX
WPF Edition.
BUILT USING
POWERFUL, HIGH PERFORMANCE C++
StockChartX is the most reliable, fastest financial chart component anywhere!
Unlike other financial chart components, StockChartX works in real time, has NO
resource leaks, produces NO access violations, and is 100% commercial open
source. In other words, you won't find hidden bugs because the source is
open!
COMPLETE SOURCE CODE AVAILABLE!
Most charting companies fail to deliver when it comes to source code and
support for modification.
If you need source code, Modulus provides complete C++ source with support
for customizations!
StockChartX compiles in VC++ 6.0, VC++ .NET 2003, VC++ .NET 2005 and 2008 compilers.
Included Example Projects
StockChartX includes over 35 example projects that
demonstrate how to perform real-time charting (free Real-Time Data Feed API trial
included), how to read data from
Microsoft Access Databases, CSV files, MetaStock data files, and other sources, display charts
within Microsoft Excel, create custom charts within VB.NET, C#, VB6, VC++, Delphi, and Borland C++, how to create charts using a
free scripting language (included) plus much more! Free
email support, live chat, and telephone technical support is included.

Every visual aspect of StockChartX is completely customizable.
Financial charting doesn't get any better than this!

Supported Examples
Visual Basic 6.0
Visual Basic .NET
Delphi 7.0
Borland C++ Builder
VC++ 6.0
VC++ 2008, 2010
C# (Desktop example and web)
Excel
Power Builder
MetaLib MetaStock Library
TRAX API
VB.NET and Access / SQL
Real Time Data Feed API
RMD Server (optional)
FreeMarketData.net (optional)
Plus much more....
Why Use StockChartX?
Modulus Financial Engineering, Inc. is a financial software consulting
firm. Years ago we could not find a financial charting component robust
enough to meet the requirements of our clients. It seemed as though
literally all charting components out there were developed by... well,
charting component companies. The reality is that charting component
developers seem to know very little if anything about real world trading.
The financial charting components produced by these companies are bundled
with standard and scientific charting components; those doughnut charts, pie charts, fancy
3D surface charts and reporting charts that you may be familiar with. The
majority of charting products out there produce stock charts with very little usability because the financial
charting interface was an afterthought. So in 1998 we decided to build our own
financial charting component to meet our needs. Now
several years later, StockChartX is a very well refined stock charting
component that we use every day. Thousands of developers, individual
traders, hedge fund managers and CTAs also use our products on a daily basis.
StockChartX
Professional Edition Features
- StockChartX supports all of the popular stock chart display styles: Candlestick, OHLCV, OHLC, and
HLC,Heiken Ashi Candles, Darvas Boxes, 3D Candlesticks, Renko, Kagi, Three Line Break, Point & Figure, Candlevolume, Equivolume,
and Shaded Equivolume. Each of these chart styles can be update in
real-time!
- Real-time automatic technical analysis updating.
- Support for built in Line Studies like Ellipse, Rectangle, Trend Line, Speed Lines, Gann Fan, Fibonacci Arcs, Fibonacci Fan, Fibonacci Retracements, Fibonacci Time Zones, Tirone Levels, Quadrant Lines, Raff Regression, and Error Channels.
- New Trend Line Penetration events notify your application whenever a
series crosses above or below a trend line. Trend lines can
automatically extend into the future.
- StockChartX uses double buffering - this means you will see absolutely
NO screen flickering.
- An unlimited number of series can be displayed in just one chart.
- Data can be imported into StockChartX from any database, text file
format, or real time feed.
- Full support for Gregorian/Julian date conversions.
- Windowing system allows users to resize, change positions up or down, maximize,
minimize, restore, and close chart windows.
- Chart windows are fully customizable programmatically. Change height, colors, styles and more from within your code.
- StockChartX manipulates screen graphics super-fast and efficiently without a 3rd party
graphics engine. This financial graph component was written by C++
experts!
- Zoom-in, Zoom-out, scroll-left, and scroll-right programmatically or via the keyboard or mouse wheel.
- Supports trend line drawing, objects (buy/sell arrows, text, etc.) and more.
- Export chart images to file (can be displayed on the web) or send to a printer.
- Users can save/load charts, restoring data, indicators, colors, drawings, period objects and more.
- Complete source code is available in VC++ (compiles in VC++ 6.0 and
VC++ .net), enabling you to modify
appearances, add new types of indicators, etc. Customize your
financial charts the way you need them!
Includes Real Time Data Feed API with VB.NET and C# Examples!
Technical Analysis
The StockChartX Professional
financial chart package is based on
our popular technical analysis SDK.
Users can add technical indicators via a dialog as shown below, or you can
add custom technical indicators programmatically without user input. You
can also use your own algorithms to display indicators with the built-in
indicator property dialog.

Built-In Technical Indicators Listing 
| Please visit our Customer Support site at
http://support.modulusfe.com to find answers to frequently asked
questions, review KB articles or ask new questions. |
 |
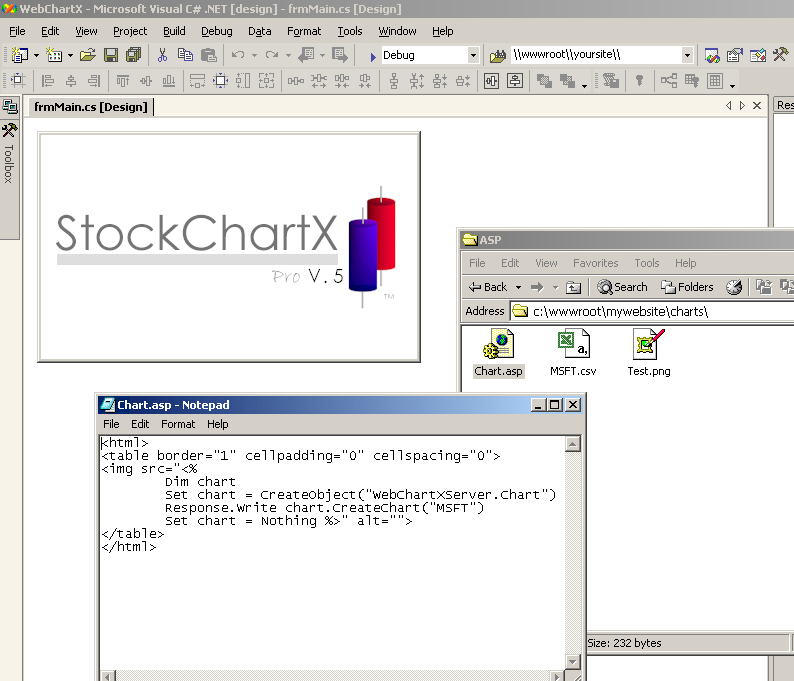
Web Charting Server
An example C# web charting server project
is bundled with StockChartX. This C# server exposes StockChartX to PHP, ASP and ASP.NET by means of a COM wrapper to
quickly deliver static GIF or PNG chart images in near real-time for web
server applications. A typical chart takes only 1/20th of a second from web
server request to finish. The C# example project is actually quite small and simple, consisting of only two small
classes! Also check out our new interactive FlashStockChart
charting component for Adboe Flash!

StockChartX can compile in VC++ .NET 2008 64-bit mode to target AMD64 or
Itanium processors running Windows 64 bit Server!
Experience up to a 50% performance increase in your server-side charting
applications!

For script-driven charting, check out TradeScript!
Frequently Asked Questions
Q. How do I insert data into
StockChartX? Is it difficult?
A. StockChartX uses a function named AppendValue (series name, date,
value). You actually "push" data into StockChartX, so it does not
matter where the data is coming from, be it a database, text file, XML file,
or real time tick-by-tick data - it all goes into StockChartX the same way,
simple, quick, and easy!
Q. What do I have to do to add an
indicator to StockChartX?
A. Just call the AddIndicatorSeries (Indicator Type, Key, UserParams)
function. If UserParams is TRUE, the indicator dialog box will appear and
the user will be allowed to edit the indicator parameters. If UserParams is
FALSE, you will be able to set the parameters programmatically in your code.
Q.
HELP! I'm not a programmer but I would like to use StockChartX. How can I
use it?
A. StockChartX comes with a very nice Microsoft Excel example
project. All you have to do is install StockChartX using the StockChartX
installation wizard and open the workbook! All the functions are
pre-programmed for you in an easy-to-use menu
system.
Q.
How many panels (stocks, indicators, etc.) can I have open at once and
tiled on top of each other?
A. Unlike all other Stock Chart Components out there, you are not
limited here. You can have many indicators, symbols, and other series open
all on one chart at once. You are only limited by your screen's real estate.
Q.
Can I select symbols, text objects, and series with my mouse and move them?
A. Yes, of course! Unlike any other Financial Chart Control,
StockChartX allows you to grab any series or object, move it around with
your mouse, resize it, drag it to another panel, scroll the chart
using the mouse wheel, resize panels with the mouse, overlay series, and
much more. StockChartX is truly "object oriented" from the
end-user's perspective.
Q. Can I retrieve technical indicator
values from StockChartX like I can with TA-SDK? And without showing the
technical indicators on the chart?
A. Yes, you can calculate technical indicators and retrieve the
values without ever displaying the indicator in your trading application.
Q. Can I
add my own custom series (like my own indicators) to the chart?
A. Yes, StockChartX is designed to allow you to add any type of
series to the chart. You can display your series in one of many series
styles (bar, line, oscillator, etc.).
Q. Can I change an individual
bar's color?
A. Yes!
Q. What is the file size of StockChartX and does it
require any run time files?
A. StockChartX is only 400kb and compiled in VC++. StockChartX.ocx is
the only file you need to redistribute with your trading application and no run time files are
required.
Q. Does StockChartX work on older operating
systems such as Windows 98 and Windows ME?
A. Yes, StockChartX runs on all Windows operating systems that are
newer than Windows 3.1, and is designed to take advantage of newer operating
system graphic APIs when available.
Q. I have a PHP server, will
StockChartX work with my web site as a server side candle chart component?
A. Yes, however since StockChartX is a COM object it requires the
Windows version of PHP, which supports COM objects. You can also use
StockChartX with either ASP or ASP.NET
Q. My question wasn't answered
here, now what?
A. Give us a call! We'd be happy to talk with you: (888) 318-3754.
You can also send us an email or
use the live help option on the top-right of this page!
Q. Do you
offer discounts on product bundles?
A. Yes, we do:
Click here to find out what users have to say about StockChartX and the
included indicator package.
StockChartX
can also be used to power a web site charting service. Click
here for a demonstration.
Want to keep informed about StockChartX? Subscribe to our RSS
feed!

Immediate Electronic Delivery
30 Day Money Back Guarantee
Allow one of our experienced financial software engineers to consult with you or your team regarding your project.
We'll provide free, professional insight along with a transcript and project diagram by e-mail, at no charge!


